Basic data
Productive system
Environmentalmanagementof theatmosphere
Sustainablemanagementofwater resources
Managementofwaste, recyclingand
decontaminationofspaces
Sustainablemanagementofenergy
Sustainableagriculture, farmingandfishing
Managementofprotectedspaces
andsustainable forestactivities
Ecotourism
Environmentaleducationandawareness-rising
Environment- related researchanddevelopment
Otherservices.Multi-scopeenvironmental
consultingorengineering
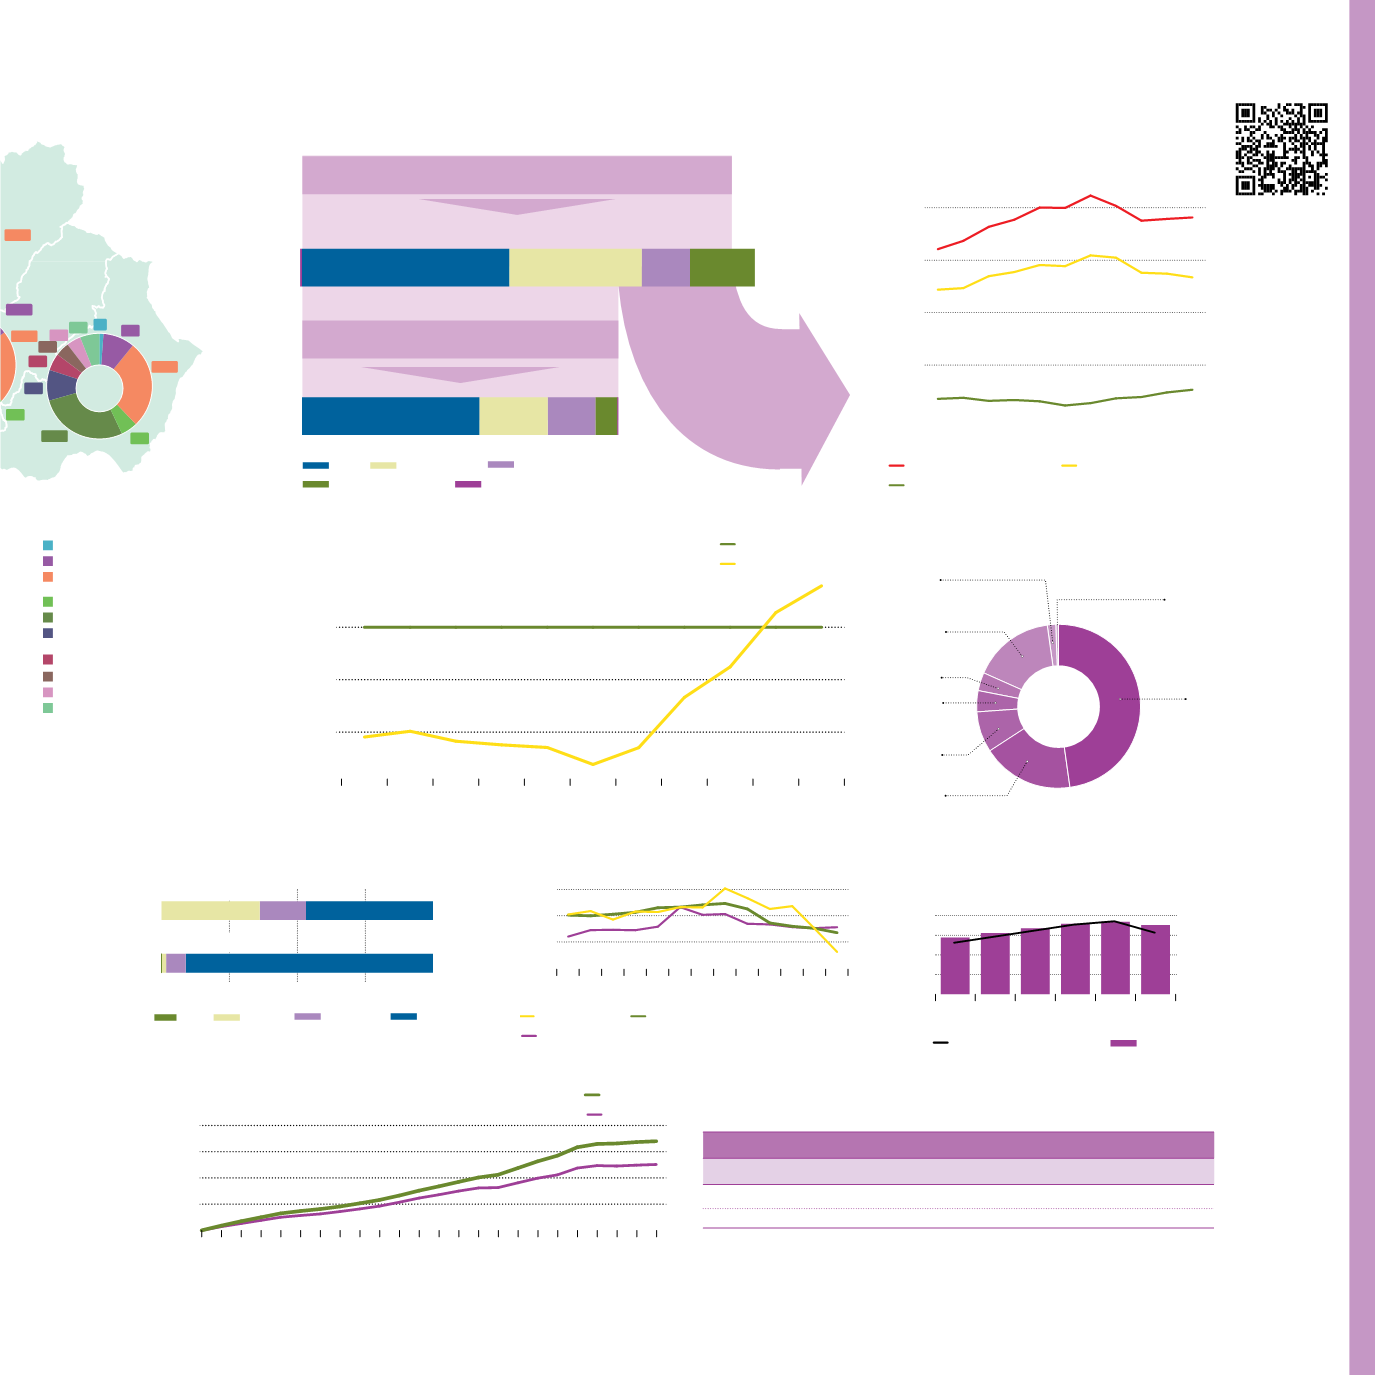
Full-time equivalent employment
by environmental sector
ent
70
1,070
563
1,653
1,871
1,566
430
297
1,600
549
307
250
257
349
23
Productive system
Oil
Natural gas
Coal
Renewable energies
Energy balance
Primary Energy Consummed
19,053.3
ktoe
Consumption in
transformation processes
and losses
Final energy consumption
13,349.3
ktoe
8,756
-82
5,603
2,039
7,493
2,890 2,017
5,704
11.1
2,738
939
Energy balance 2011
[12]
2,000
1,500
1,000
500
0
Ktep
2001 2002 2003 2004 2005 2006 2007 2008 2009 2010 2011
Primary energy consumption
Final energy consumption
Domestic energy production
Evolution of domestic energy
production and consumption
[12]
12
9
6
3
Percentage
2001
2002
2003
2004
2005
2006
2007
2008
2009
2010
2011
Andalusia
EuropeanUniongoal
Renewable energies penetration
index in Andalusia
[12]
4.1%
Photovoltaic
0.5%
Natural gas
48.0%
Biomass
3,5%
Hydraulic
1,9%
Solar Thermal Energy
16,1%
Solar Thermal
Electricity
8.1%
Coal
18.0%
Wind
Domestic energy production 2011
[12]
Breeding farms
Grow-out farms
0
25
50
75
100%
Algae
Molluscs
Crustaceans
Fish
12,746
6,000
16,456
140
596
7,511
Marine aquaculture 2011
[4]
Units:
Breeding farm data (thousands of units) and Grow-out farm data (tons).
120
90
60
30
Index 2005 = 100
20002001 2002 2003 2004 2005 20062007 2008 2009 2010 2011 2012
Extractive industries
Manufacturing industries
Electricity,gas,vapourandair conditioning supply
Industrial production
[3]
Nº Bed-places
Nº Tourist accomodation
Bed-places
Touristaccomodationestablishments
0
100,000
300,000
500,000
1,000
3,000
6,000
0
2002 2004 2006 2008 2010 2011
Bed-places and tourist accomodation
establishments
[13]
300
250
200
150
100
index 1988 = 100
1989 1991 1993 1995 1997 1999 2001 2003 2005 2007 2009 2011
Andalusian rate
National rate
Transport.
Evolution in the number of vehicles
[3]
Andalusia
Spain
Vehicles/ 100 inhab.
Motorization rate 2011
63.69
66.26
Population (inhab.)
Scope
Vehicles
5,365,010
31,269,081
8,424,102
47,190,493


