Basic data
Scenario A1B
Scenario A2
Scenario B1
-5
–
-10
0
–
-5
+5
–
0
+5
–
+10
+10
–
+15
+15
–
+20
+20
–
+30
> +30
Percentage
-10
–
- 15
-15
–
- 20
-20
–
-30
< -30
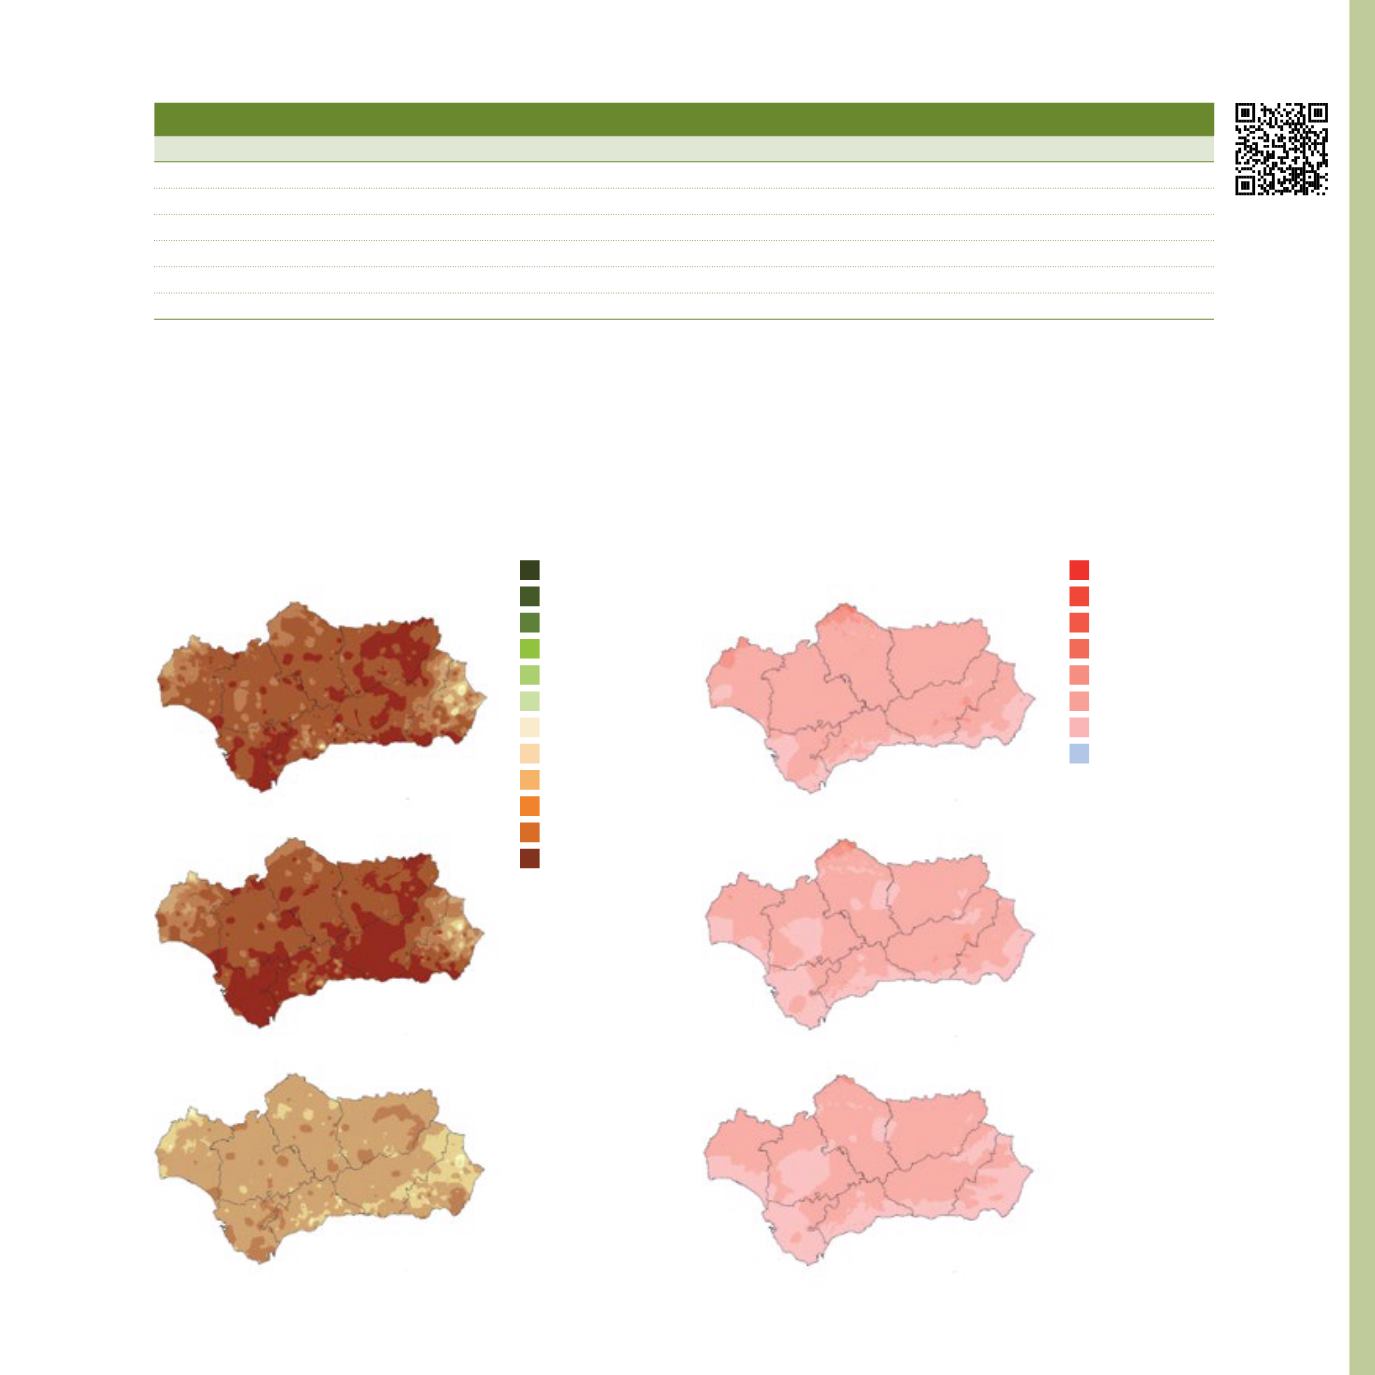
Climate scenarios in Andalusia: foreseen variations for the 2041-2070 period with regard to historical series
Rainfall
Scenario B1
Scenario A1B
Scenario A2
+4
+5
+6
+7
°C
+3
+2
+1
0
Temperatures
Note:
The A1B scenario
describes a world
characterised by
a fast economic
growth, based on
the balanced use
of different ener-
gy sources and
in which regions
progressively con-
verge. The A2 sce-
nario describes a
more heteroge-
neous world cha-
racterised by self-
sufficiency and by
the preservation of
local identities. The
B1 scenario descri-
bes a converging
world that advan-
ces towards eco-
nomic, social and
environmental sus-
tainability, without
additional climate-
related measures.
Natural Resources
(1)
Gross emissions data, without subtracting carbon sinks.
(2)
Industrial sector refers to facilities of the European Union Emissions Trading System (EU ETS).
No data: “-”.
Total emissions in Spain (ktCO
2
eq) (1)
Total emissions in Andalusia (ktCO
2
eq) (1)
Industrial Sector Emissions in Andalusia (ktCO
2
eq) (2)
Diffuse Sector Emissions in Andalusia (ktCO
2
eq)
Total emissions in Spain per inhabitant (tCO
2
eq/hab)
Total emissions in Andalusia per inhabitant (tCO
2
eq/hab)
285,054
36,627
-
-
7.23
5.25
1990
435,428
66,225
32,346
33,480
9.86
8.32
2005
427,227
65,626
31,764
33,592
9.56
8.15
2006
436,327
67,252
33,447
33,801
9.71
8.27
2007
403,819
58,320
27,234
30,955
8.79
7.05
2008
366,266
56,412
25,645
30,330
7.84
6.71
2009
355,898
55,386
-
-
7.57
6.62
2010
Comparison of the Evolution of Greenhouse Gases (GHG) between Spain and Andalusia
[4][8]
7
Climate and climate change


